Machine learning crash course
1. Introduction to Machine Learning
Presented by Thức NC
Traditional program vs ML
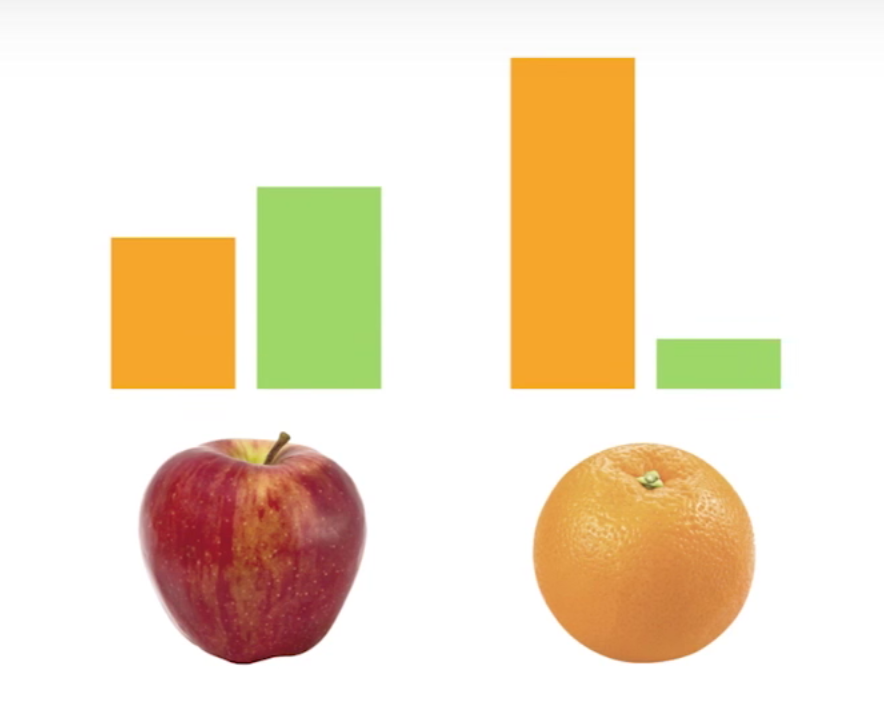
Can you write traditional rule based program to tell the difference between an orange and an apple?
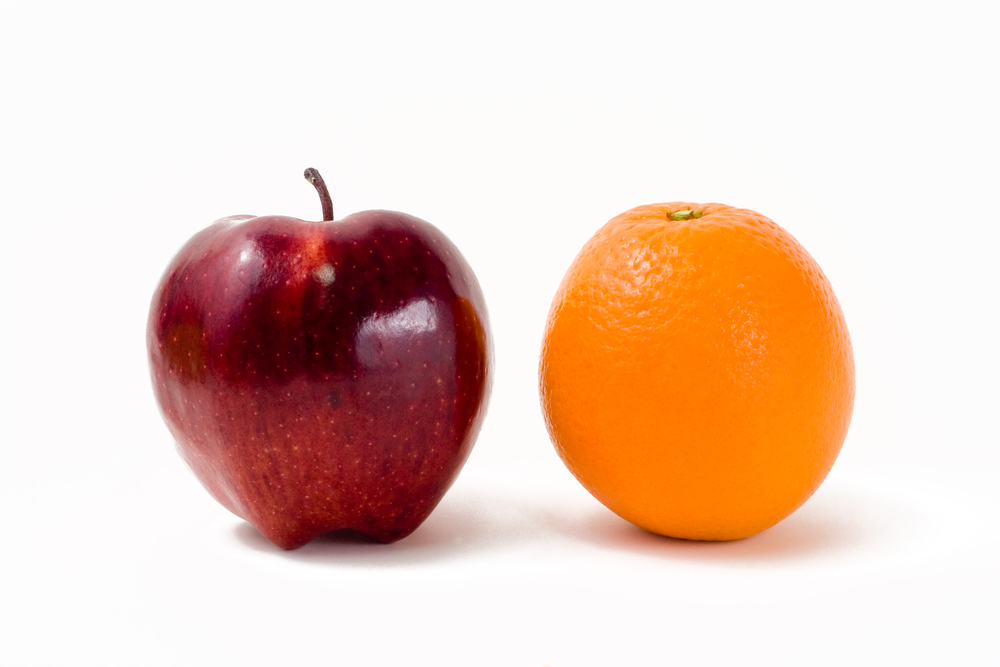
How many orange & green pixels?
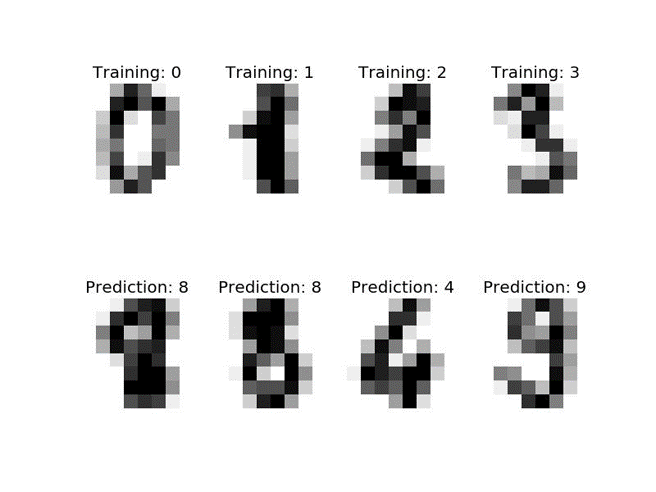
How about these images?
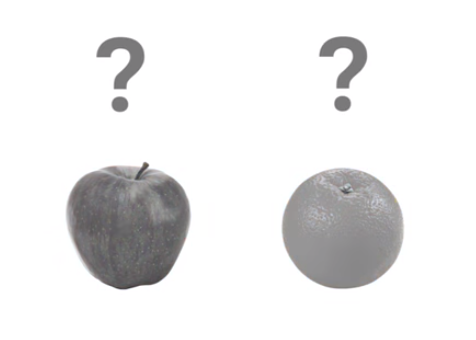
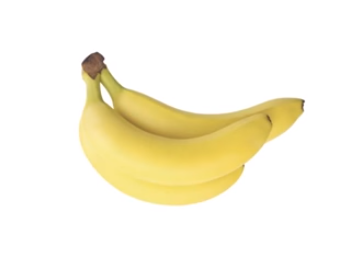
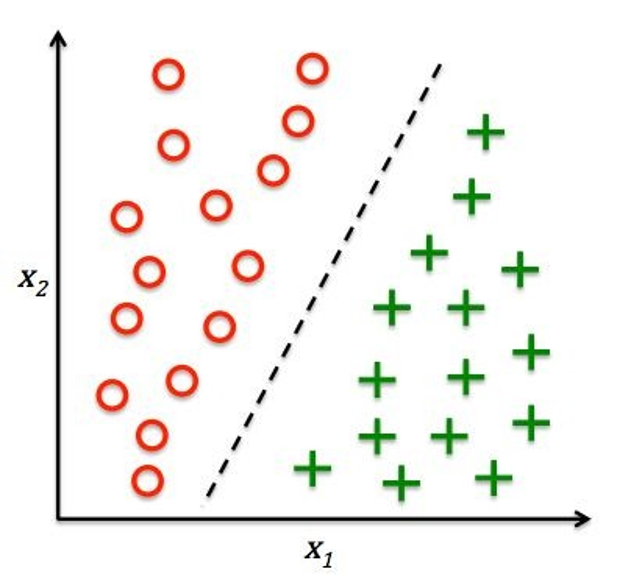
For that we need a classifier
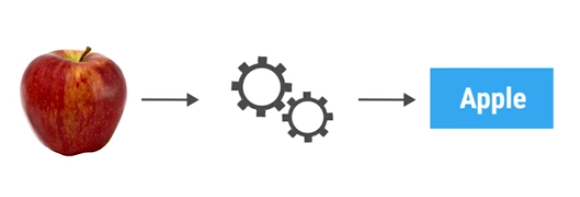
- You can think of a classifier as a function, that take data as input and assigns a label to it as output.
- ML technique that writes the classifier automatically is called Supervised learning.
Traditional program vs ML
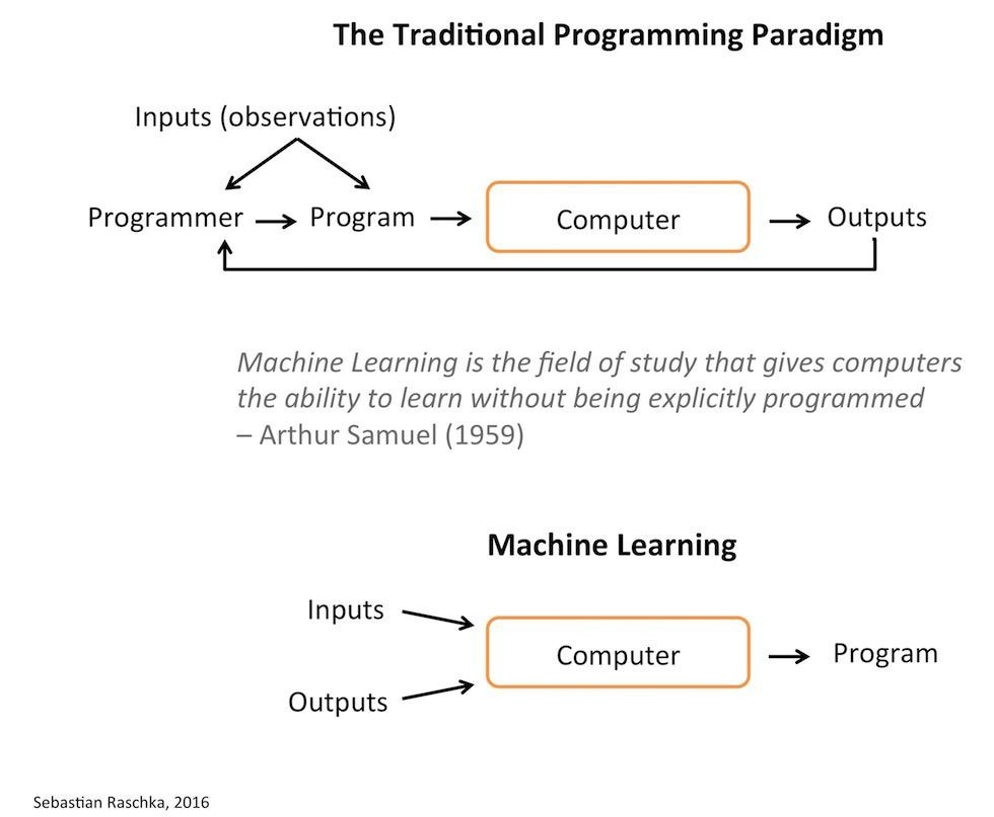
Standard programming paradigm
The developer identifies the algorithm and implements the code; the users supply the data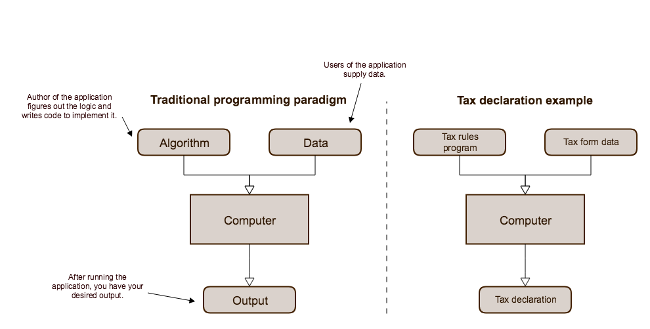
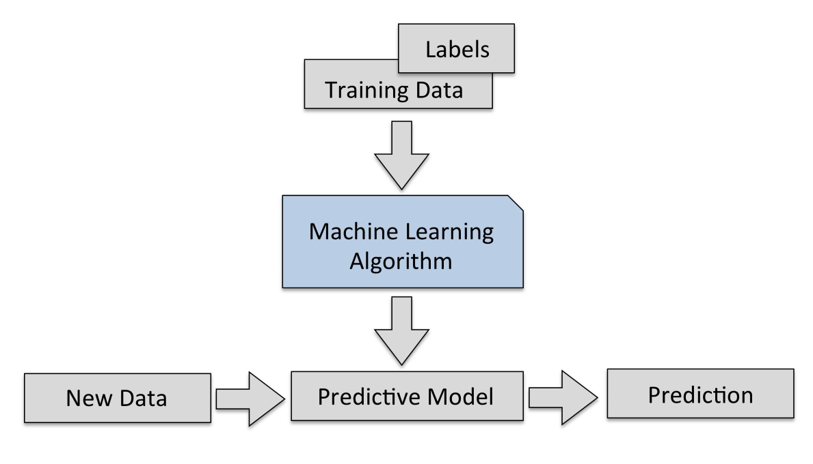
Machine learning paradigm
During development, we generate an algorithm from a data set and then incorporate that into our final application.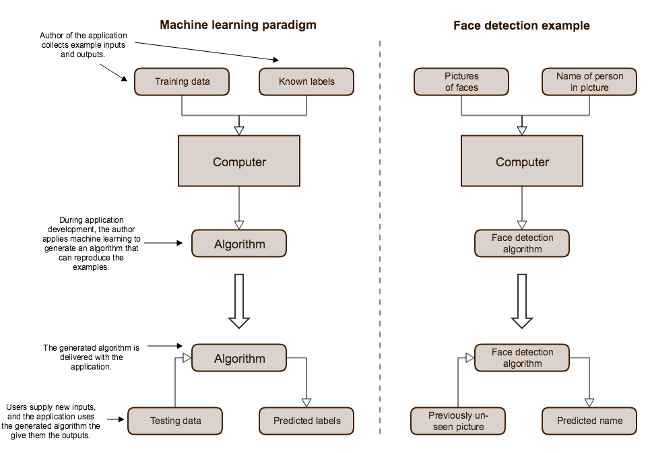
Types of machine learning
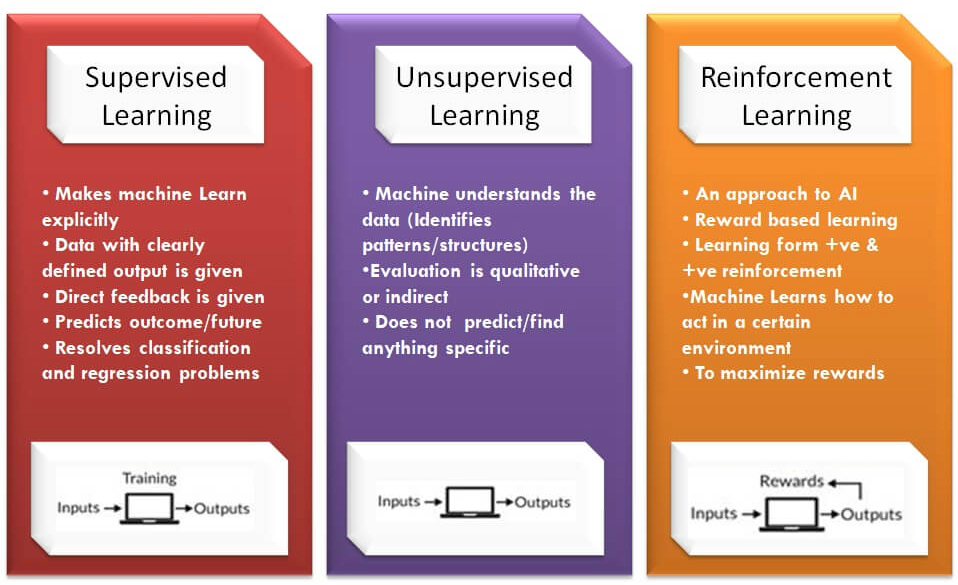
Supervised learning
- Learn a model from labeled training data
- Make predictions about unseen or future data
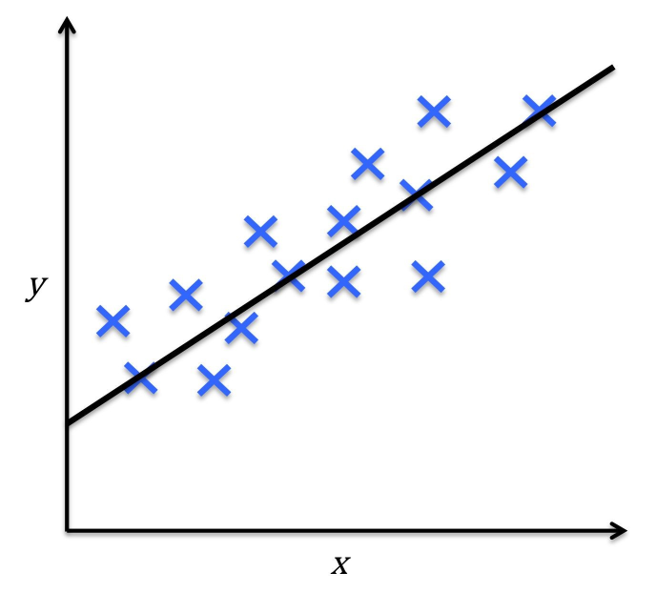
Classification
Regression
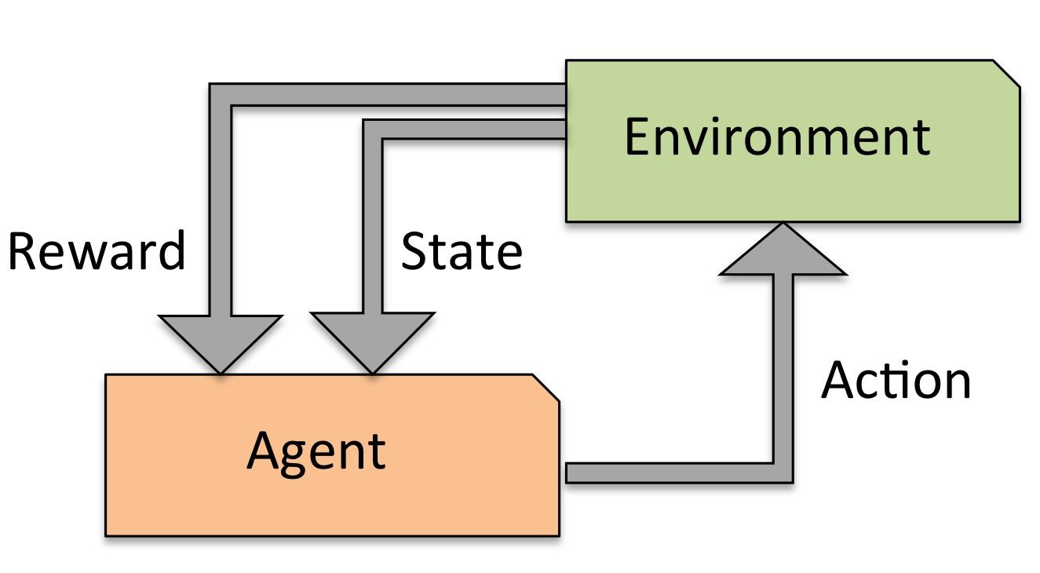
Reinforcement Learning
- Solving interactive problems
- The agent tries to maximize the reward by a series of interactions with the environment
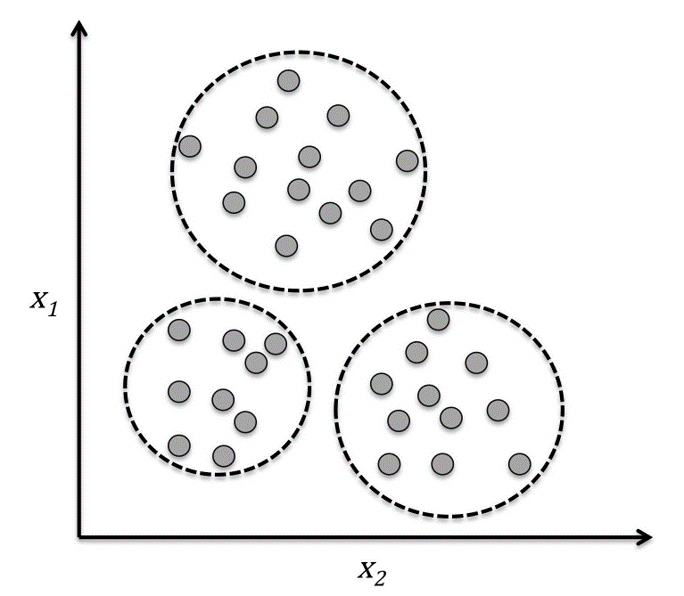
Clustering
- Organize data into meaningful subgroups (clusters) without having any prior knowledge of their group memberships.
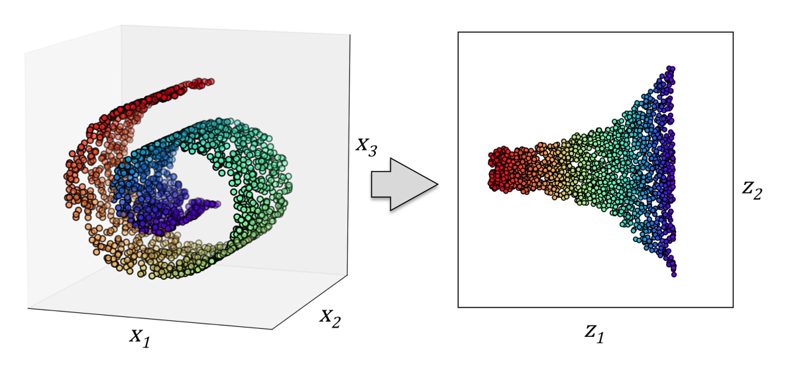
Dimensionality reduction
- Remove noise from data
- Compress the data onto a smaller dimensional subspace while retaining most of the relevant information
- Also useful for visualizing data
Dimensionality reduction
Compress a 3D Swiss Roll onto a new 2D feature subspace
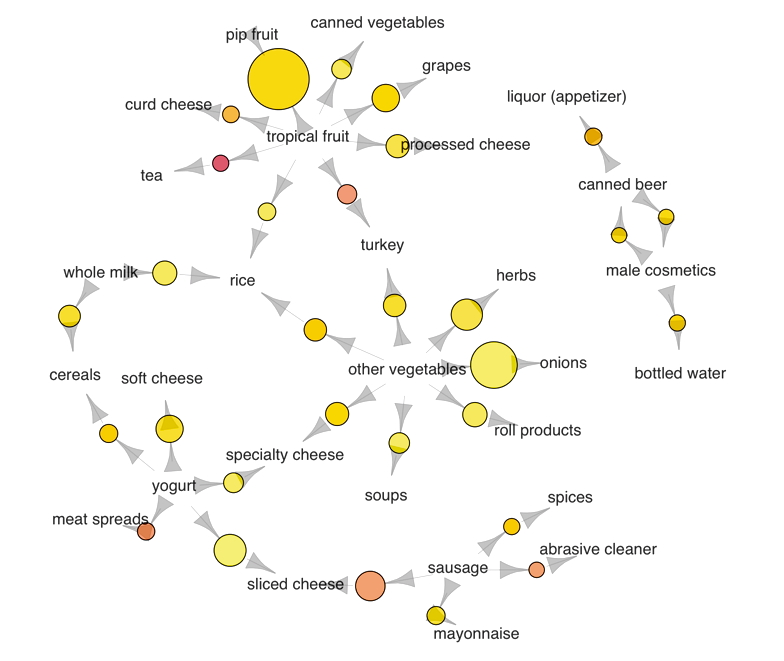
Association Rules
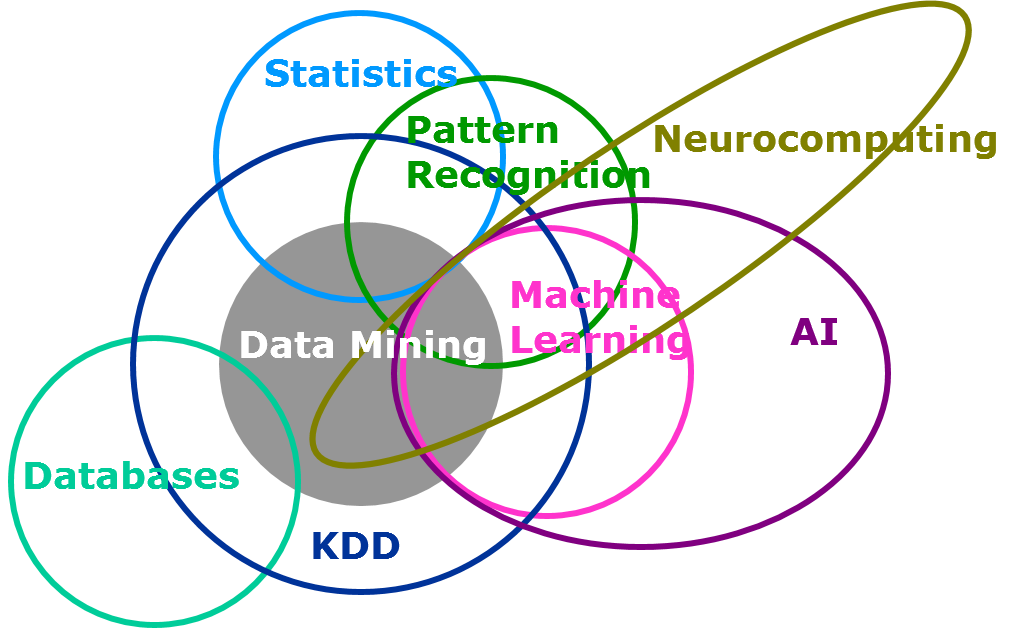
Machine learning vs ...

Machine learning vs ...
Machine learning pipeline
Feature engineering
Feature engineering is the process of transforming raw data into inputs for a machine learning algorithm.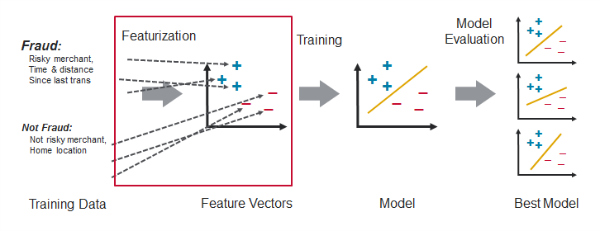
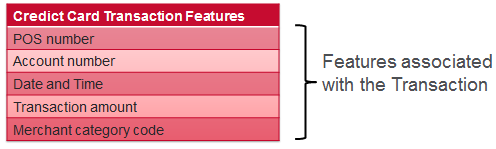
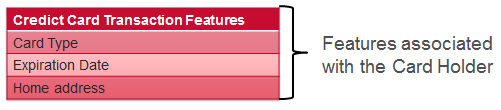
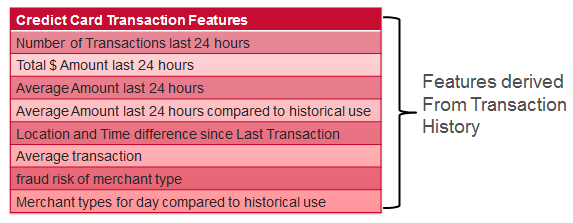
Feature engineering example - Credit Card Fraud detection
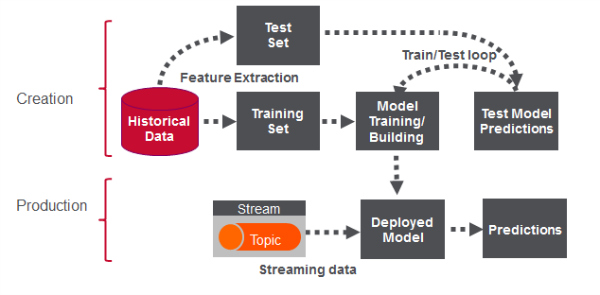
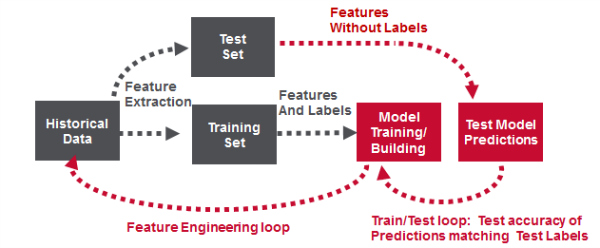
Model building workflow
Quiz - Question 1
Q1. Suppose you want to develop a supervised machine learning model to predict whether a given email is "spam" or "not spam". Which of the following statements are true?
- A. We'll use unlabeled examples to train the model.
- B. Words in the subject header will make good labels.
- C. Emails not marked as "spam" or "not spam" are unlabeled examples.
- D. The labels applied to some examples might be untrustworthy.
Quiz - Question 2
Q2. Suppose an online shoe store wants to create a supervised ML model that will provide personalized shoe recommendations to users. That is, the model will recommend certain pairs of shoes to Marty and different pairs of shoes to Janet. Which of the following statements are true?
- A. Shoe size is a useful feature.
- B. User clicks on a shoe's description is a useful label.
- C. Shoe beauty is a useful feature.
- D. The shoes that a user adores is a useful label.
Quiz - Question 3
Q3. Suppose you are working on weather prediction, and you would like to predict whether or not it will be raining at 5pm tomorrow. You want to use a learning algorithm for this. Would you treat this as a classification or a regression problem?
Quiz - Question 4
Q4. Suppose you are working on stock market prediction, and you would like to predict the price of a particular stock tomorrow (measured in dollars). You want to use a learning algorithm for this. Would you treat this as a classification or a regression problem?
Quiz - Question 5
Q5. Some of the problems below are best addressed using a supervised learning algorithm, and the others with an unsupervised learning algorithm. Which of the following would you apply supervised learning to?
- Take a collection of 1000 essays written on the US Economy, and find a way to automatically group these essays into a small number of groups of essays that are somehow "similar" or "related".
- Given a large dataset of medical records from patients suffering from heart disease, try to learn whether there might be different groups of such patients for which we might tailor separate treatements.
- Given genetic (DNA) data from a person, predict the odds of him/her developing diabetes over the next 10 years.
- Given 50 articles written by male authors, and 50 articles written by female authors, learn to predict the gender of a new manuscript's author (when the identity of this author is unknown).
- In farming, given data on crop yields over the last 50 years, learn to predict next year's crop yields.
- Examine a large collection of emails that are known to be spam email, to discover if there are sub-types of spam mail.
- Examine a web page, and classify whether the content on the web page should be considered "child friendly" (e.g., non-pornographic, etc.) or "adult."
- Examine the statistics of two football teams, and predicting which team will win tomorrow's match (given historical data of teams' wins/losses to learn from).
Linear regression
Cricket database: Chirps per Minute vs. Temperature. What is the relationship?
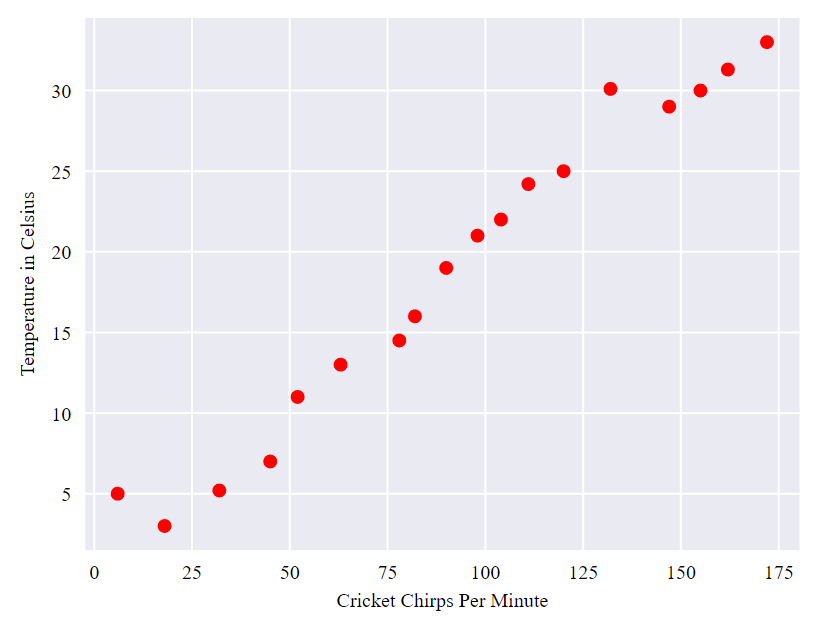
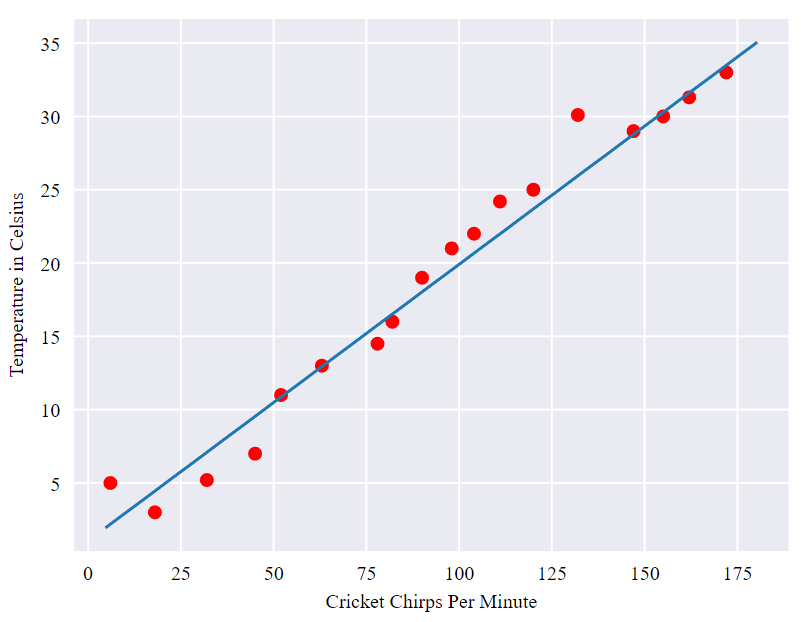
Linear regression
The relationship seems to be linear
Loss
- Loss is a number indicating how bad the model's prediction was on a single example.
- The goal of training a model is to find a set of weights and biases that have low loss, on average, across all examples.
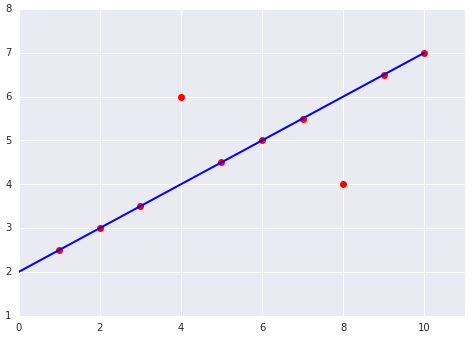
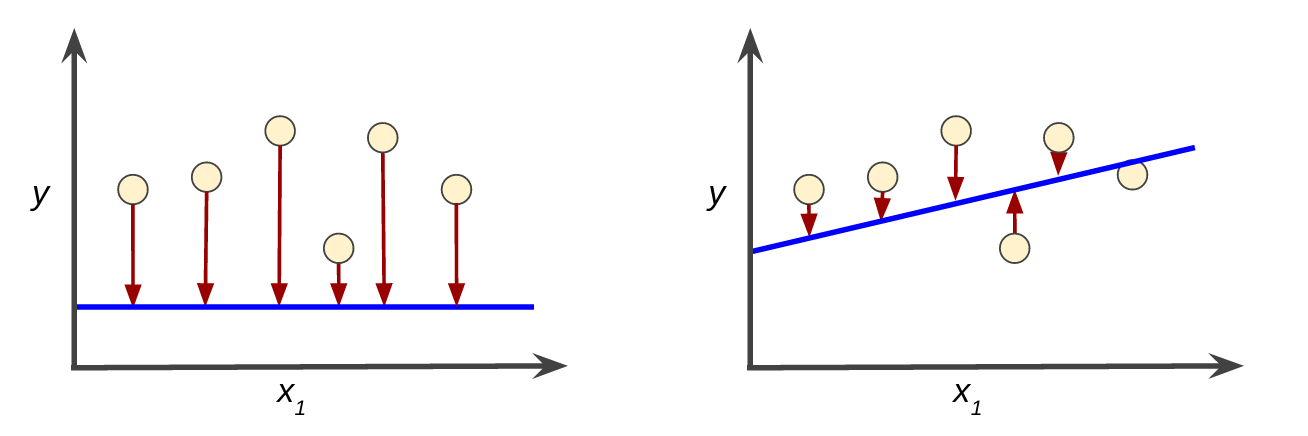 High loss in the left model; low loss in the right model.
Quiz
Which of the two data sets shown in the preceding plots has the higher Mean Squared Error (MSE)?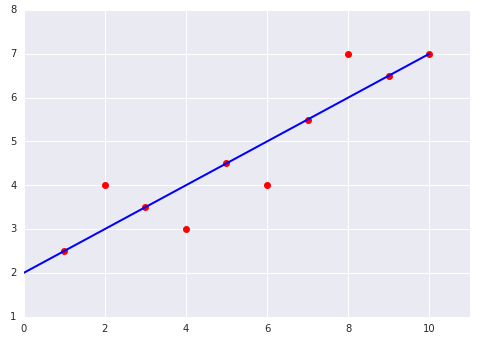
Reducing Loss
- To train a model, we need a good way to reduce the model’s loss
- An iterative approach is one widely used method for reducing loss, and is as easy and efficient as walking down a hill.
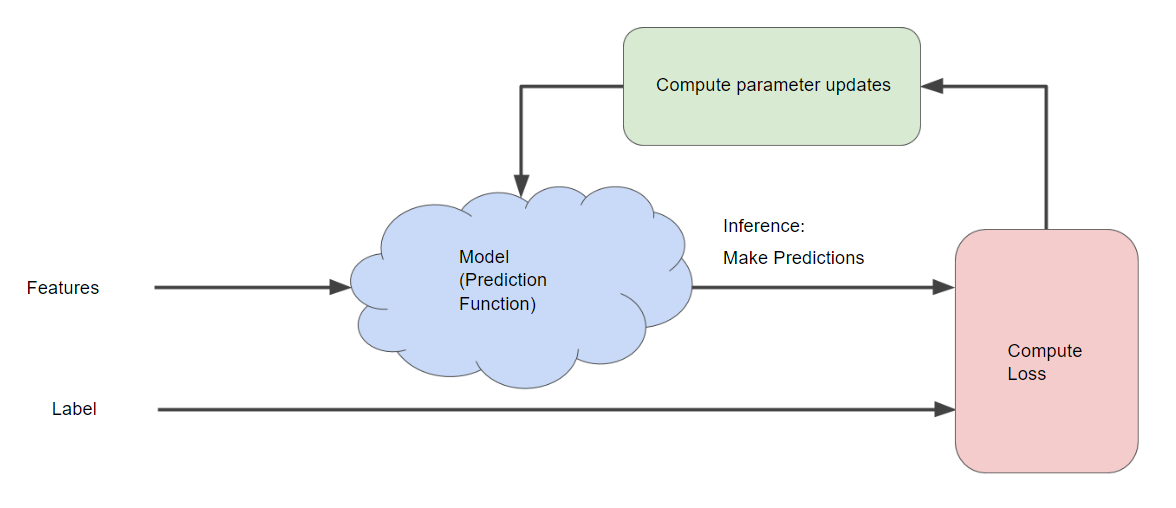
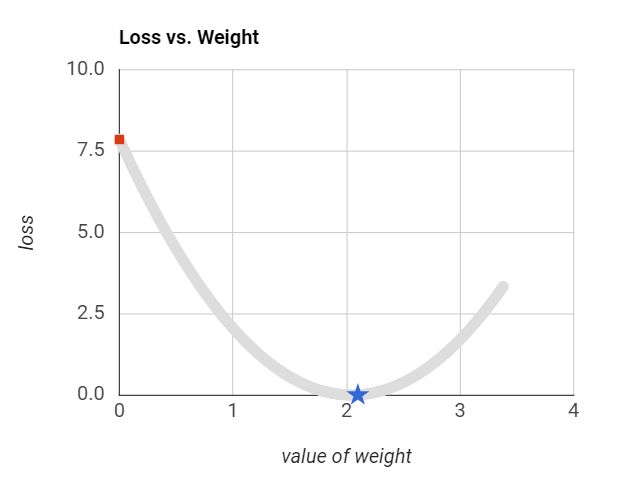
Gradient descent
- An algorithm for "Compute parameter updates" part
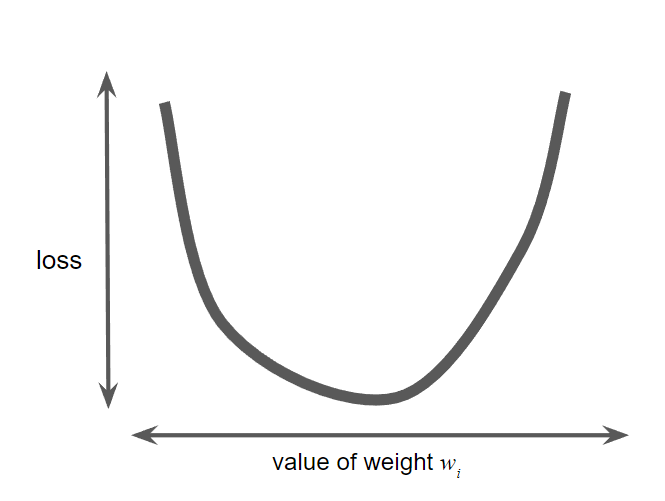
- Goal: Find $w_1$ that minimize the loss
- An inefficient way: calculating the loss function for every value of $w_1$ over the entire data set
- Better mechanism: gradient descent
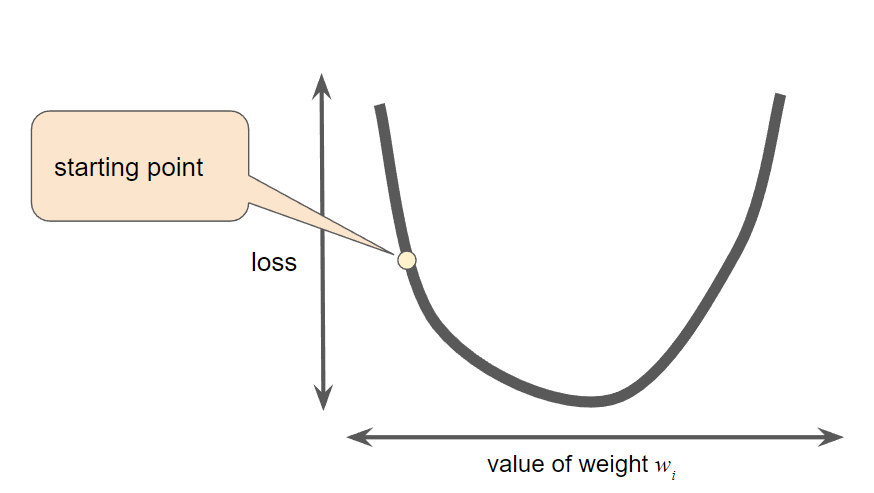
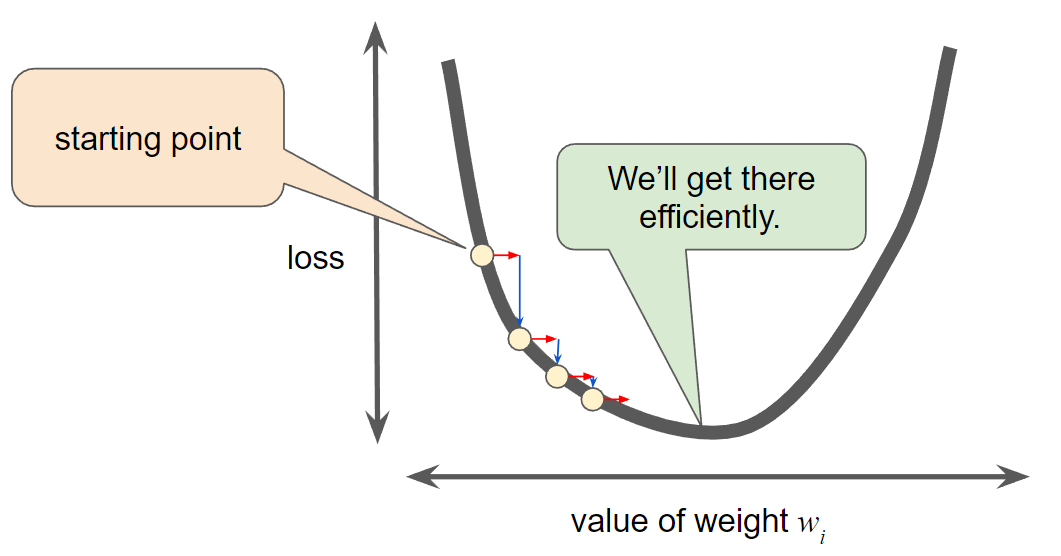
Gradient descent
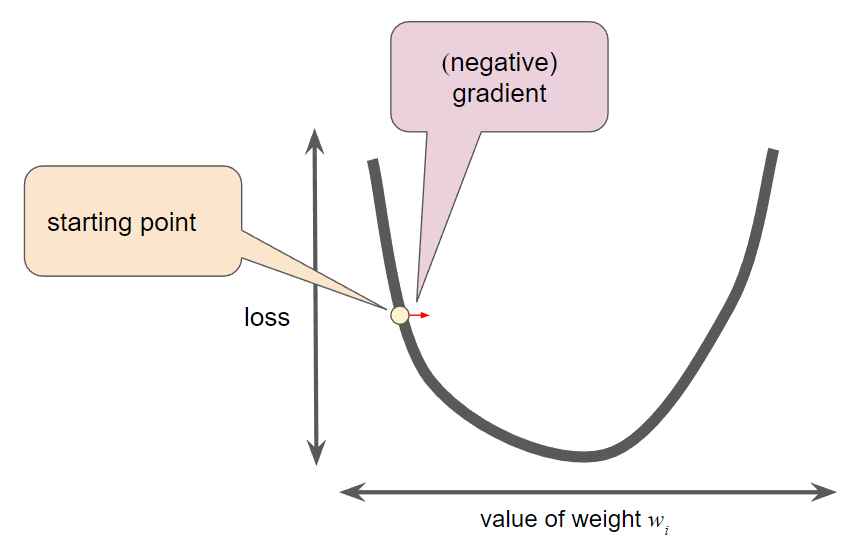
- First step: pick a starting value for $w_1$ (normal, 0 or random value)
- The gradient descent algorithm then uses the gradient of the loss curve at the current point to calculate next point.
Gradient descent
- The gradient of loss is: the derivative (slope) of the curve, and tells you which way is "warmer" or "colder."
- With multiple weights, the gradient is a vector of partial derivatives with respect to the weights.
Gradient descent
- The gradient always points in the direction of steepest increase in the loss function
- In gradient descent, we are trying to minimize the loss by following the negative of the gradient: $-\nabla f$
Gradient descent
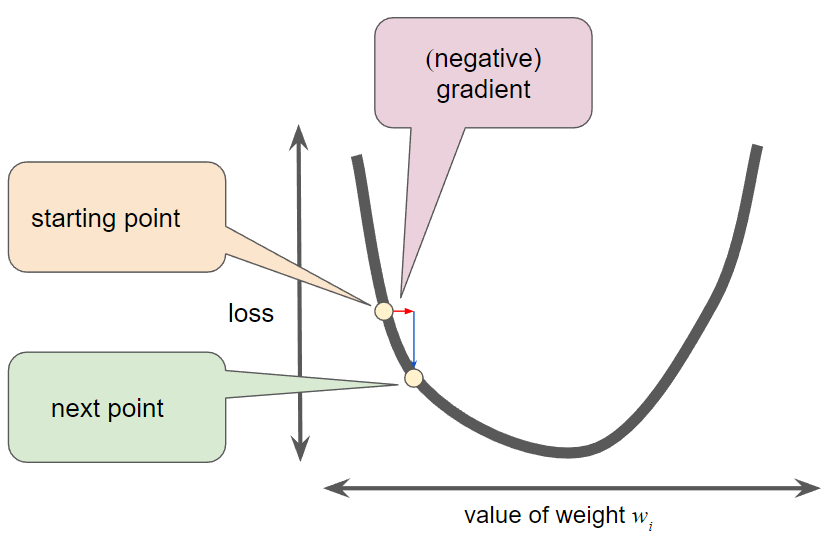
- Note that a gradient is a vector, so it has both: a direction and a magnitude
- Determine the next point: adds some fraction of the gradient's magnitude to the current point
Learning rate
- Gradient descent algorithms multiply the gradient by a scalar known as the learning rate (also sometimes called step size) to determine the next point
- Hyperparameters are the knobs that programmers tweak in machine learning algorithms.
- Learning rate is a hyperparameter. Most machine learning programmers spend a fair amount of time tuning the learning rate.
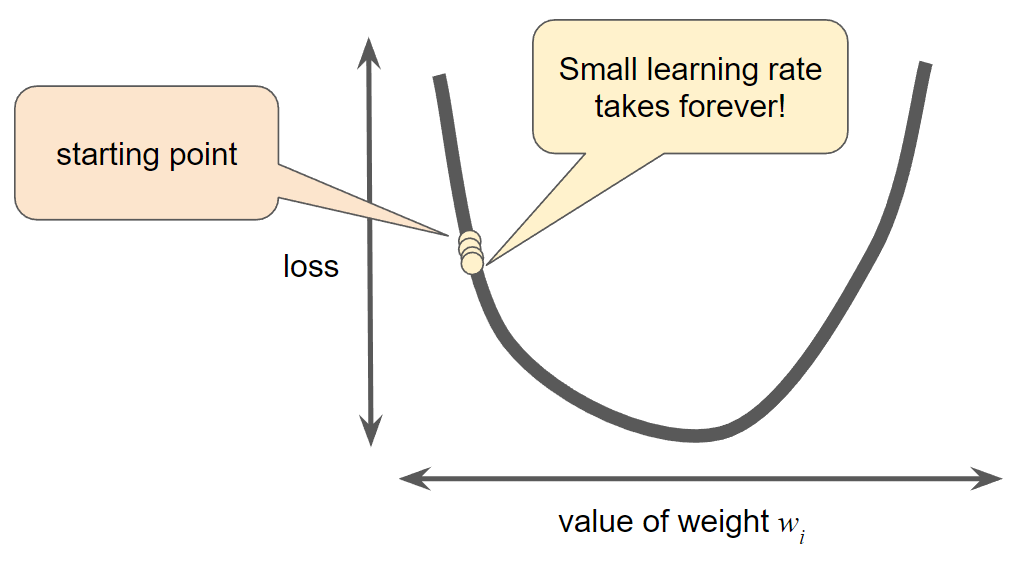
Learning rate
- Learning rate is too small, learning will take too long:
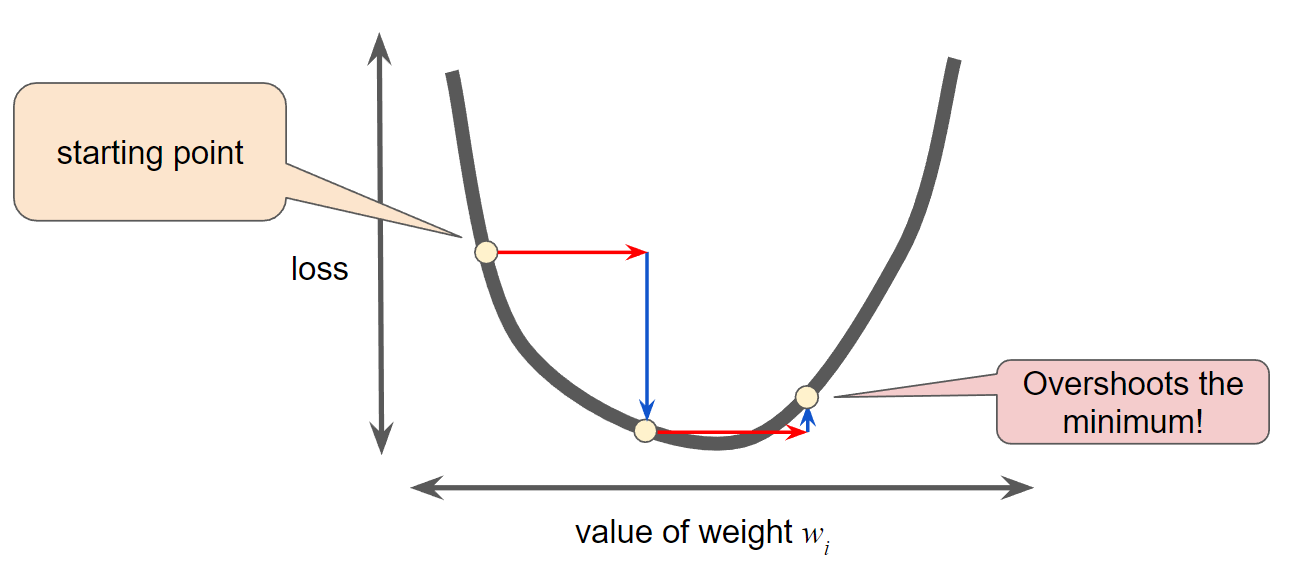
Learning rate
- Learning rate is too large, the next point will perpetually bounce haphazardly across the bottom:
Good learning rate
- For every regression problem, there is a way to find the idea learning rate:
- In one-dimension: $\frac{1}{f(x)''}$
- For 2 or more dimensions: the inverse of the Hessian (matrix of second partial derivatives)
Hands-on: Calculate next values of weights
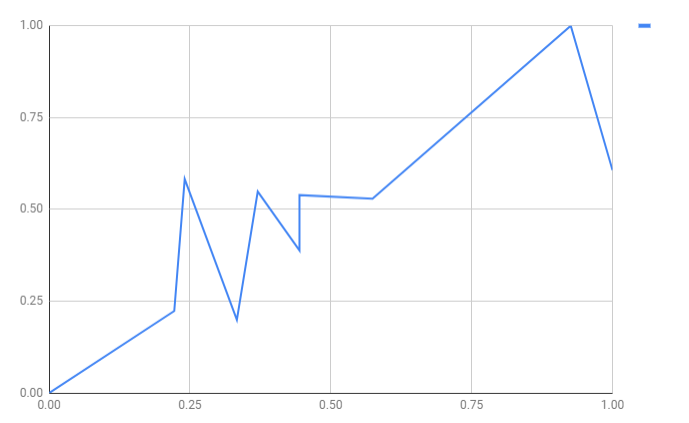
| House size (X) | Price (Y) | X (Min-max Standardized) | Y (Min-max Standardized) |
|---|---|---|---|
| 1,100 | 199,000 | 0.00 | 0.00 |
| 1,400 | 245,000 | 0.22 | 0.22 |
| 1,425 | 319,000 | 0.24 | 0.58 |
| 1,550 | 240,000 | 0.33 | 0.20 |
| 1,600 | 312,000 | 0.37 | 0.55 |
| 1,700 | 279,000 | 0.44 | 0.39 |
| 1,700 | 310,000 | 0.44 | 0.54 |
| 1,875 | 308,000 | 0.57 | 0.53 |
| 2,350 | 405,000 | 0.93 | 1.00 |
| 2,450 | 324,000 | 1.00 | 0.61 |
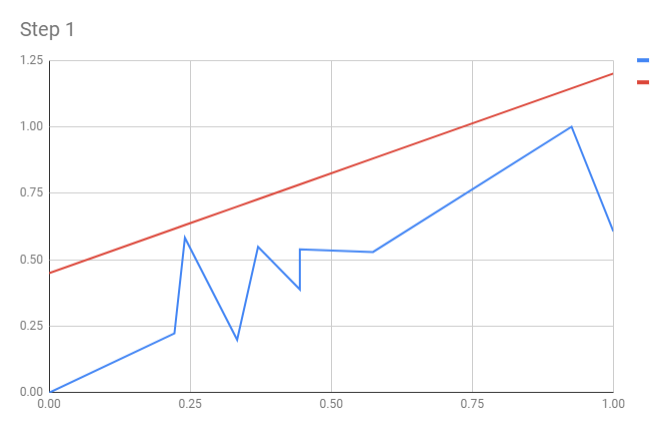
Linear regression
- Model: $y' = a + bx$
- Starting value: $(a,b)=(0.45,0.75)$
- Loss function: Sum of Squared Errors
Step 1. Calculate loss (SSE)
| X | Y | a | b | Y' | SSE |
|---|---|---|---|---|---|
| 0.00 | 0.00 | 0.45 | 0.75 | 0.45 | 0.101 |
| 0.22 | 0.22 | 0.62 | 0.077 | ||
| 0.24 | 0.58 | 0.63 | 0.001 | ||
| 0.33 | 0.20 | 0.70 | 0.125 | ||
| 0.37 | 0.55 | 0.73 | 0.016 | ||
| 0.44 | 0.39 | 0.78 | 0.078 | ||
| 0.44 | 0.54 | 0.78 | 0.030 | ||
| 0.57 | 0.53 | 0.88 | 0.062 | ||
| 0.93 | 1.00 | 1.14 | 0.010 | ||
| 1.00 | 0.61 | 1.20 | 0.176 | ||
| Total: | 0.677 |
Input examples
Step 2. Calculate gradient
| X | Y | a | b | Y' | SSE=f(a,b) | df/da | df/db |
|---|---|---|---|---|---|---|---|
| 0.00 | 0.00 | 0.45 | 0.75 | 0.45 | 0.101 | 0.45 | 0.00 |
| 0.22 | 0.22 | 0.62 | 0.077 | 0.39 | 0.09 | ||
| 0.24 | 0.58 | 0.63 | 0.001 | 0.05 | 0.01 | ||
| 0.33 | 0.20 | 0.70 | 0.125 | 0.50 | 0.17 | ||
| 0.37 | 0.55 | 0.73 | 0.016 | 0.18 | 0.07 | ||
| 0.44 | 0.39 | 0.78 | 0.078 | 0.39 | 0.18 | ||
| 0.44 | 0.54 | 0.78 | 0.030 | 0.24 | 0.11 | ||
| 0.57 | 0.53 | 0.88 | 0.062 | 0.35 | 0.20 | ||
| 0.93 | 1.00 | 1.14 | 0.010 | 0.14 | 0.13 | ||
| 1.00 | 0.61 | 1.20 | 0.176 | 0.59 | 0.59 | ||
| Total: | 0.677 | 3.30 | 1.55 |
Our initial model
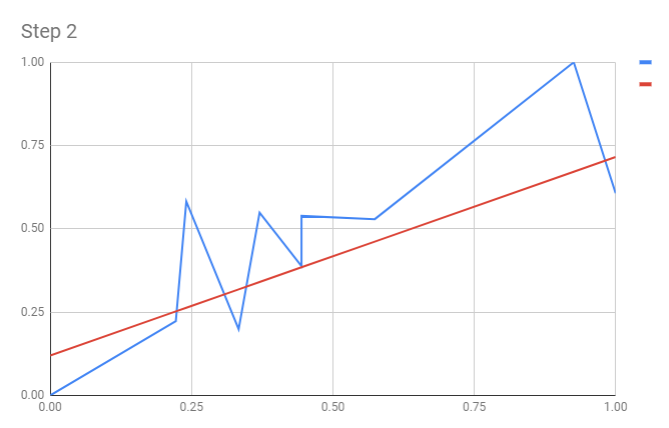
Step 3. Update weight, re-calculate SSE
- Take learning rate $ \alpha=0.1$
- Update weights:
- $a_{new} = a - \alpha\times\frac{\partial f}{\partial a} = 0.45-0.1 \times 3.30 = 0.12$
- $b_{new} = b - \alpha\times\frac{\partial f}{\partial b} = 0.75-0.1 \times 1.55 = 0.60$
| X | Y | a | b | Y' | SSE=f(a,b) | df/da | df/db | new a | new b | new Y' | new SSE |
|---|---|---|---|---|---|---|---|---|---|---|---|
| 0.00 | 0.00 | 0.45 | 0.75 | 0.45 | 0.101 | 0.45 | 0.00 | 0.12 | 0.60 | 0.12 | 0.007 |
| 0.22 | 0.22 | 0.62 | 0.077 | 0.39 | 0.09 | 0.25 | 0.000 | ||||
| 0.24 | 0.58 | 0.63 | 0.001 | 0.05 | 0.01 | 0.26 | 0.051 | ||||
| 0.33 | 0.20 | 0.70 | 0.125 | 0.50 | 0.17 | 0.32 | 0.007 | ||||
| 0.37 | 0.55 | 0.73 | 0.016 | 0.18 | 0.07 | 0.34 | 0.022 | ||||
| 0.44 | 0.39 | 0.78 | 0.078 | 0.39 | 0.18 | 0.38 | 0.000 | ||||
| 0.44 | 0.54 | 0.78 | 0.030 | 0.24 | 0.11 | 0.38 | 0.012 | ||||
| 0.57 | 0.53 | 0.88 | 0.062 | 0.35 | 0.20 | 0.46 | 0.002 | ||||
| 0.93 | 1.00 | 1.14 | 0.010 | 0.14 | 0.13 | 0.67 | 0.054 | ||||
| 1.00 | 0.61 | 1.20 | 0.176 | 0.59 | 0.59 | 0.72 | 0.006 | ||||
| Total: | 0.677 | 3.30 | 1.55 | 0.161 |
Our model after updating weight
Hands-on: Optimize learning rate
- Optimize learning rate exercise in MLCC
- Challenge: calculate optimal learning rate mathematically
Stochastic Gradient Descent
- In gradient descent, a batch is the total number of examples you use to calculate the gradient in a single iteration.
- Stochastic gradient descent (SGD) uses only a single (random) example (a batch size of 1) per iteration
- Mini-batch SGD is a compromise between full-batch iteration and SGD. A mini-batch is typically between 10 and 1,000 examples, chosen at random.
Reducing Loss: Playground Exercise
- Reducing Loss: Playground Exercise in MLCC
- Challenge: calculate optimal learning rate mathematically
Quiz
Q1. Suppose gradient descent is used to try to find the minimum of the function $f(x,y) = 1+x^2+y^2$ starting at the point $(1,1)$. What will the x and y coordinates be after the first step, given the learning rate of $0.5$?
Quiz
Q2. Suppose gradient descent is used on function $f(x)=x^2-1$. If the gradient descent begins at $x=-1$ and uses the learning rate of $1.0$, in how many steps will it converge to the global minimum $x=0$?